Now that we know Ireland’s 2030 emissions targets, what will our 2025 targets be?

Summary: to stay within our carbon budgets, we may need to reduce electricity emissions by as much as 16% a year, transport emissions by 9% a year, and agriculture emissions by 5% a year between 2022 and 2025 to stay within our first carbon budget. There are quite a few caveats with this data, primarily relating to LULUCF (Land Use, Land Use Change, and Forestry) emissions, detailed at the end of the post, and it is possible I have underestimated the first carbon budget by 6.5 Mt and the second carbon budget by 9.3 Mt, due to the changes in the baseline for LULUCF emissions. However I think it’s important to discuss possible emissions trajectories as early as possible in the carbon budget period if we are to be successful in staying within that budget.

On Thursday 28th July, the government announced sectoral emissions targets for 2030. Essentially these are the emissions each sector will need to emit in 2030 if we are to stay within the two carbon budgets to 2030 adopted by the Oireachtas.

Although the 2025 targets (end of the first carbon budget period) and the actual sectoral emissions ceilings were not announced last week, enough information was provided to enable a prediction of what the 2025 targets will be and how much we will need to reduce emissions in each sector each year.

Here’s the summary table for the period of the first carbon budget 2021-2025 (which we’re already in the middle of)

2025 targets

Sector 2021 2025 target % reduction 2022-5 (4 yrs) Annual % reduction 22-25 (4 yrs)
Electricity 10.27 5.3 48% 16%
Transport 10.91 7.5 31% 9%
Non res bldgs 1.48 1.2 21% 6%
Res bldgs 7.04 5.0 29% 9%
Industry 7.05 5.0 30% 9%
Agri 23.10 19.1 17% 5%
Other 1.67 1.2 26% 8%
LULUCF* 7.77 4.4 43% 14%
Other savings
Total 69.29 48.7 30% 9%

And here’s the second carbon budget period 2026-2030.

2030 targets

Sector 2025 Mt CO2e 2030 target % reduction 2025-30 (5 yrs) Annual % reduction 2026-30 (5yrs)
Electricity 5.3 3 44% 12%
Transport 7.5 6 20% 5%
Non res bldgs 1.2 1 15% 3%
Res bldgs 5.0 4 19% 4%
Industry 5.0 4 19% 4%
Agri 19.1 17.24 10% 2%
Other 1.2 1 19% 4%
LULUCF* 4.4 4.0 10% 2%
Other savings -5.7 18%
Total 48.7 31.54 29% 7%

And here are two larger tables showing actual emissions values for each year, and the totals for each carbon budget

First carbon budget 2021-2025

2021 2022 2023 2024 2025 Sectoral emissions ceiling % share of carbon budget
Electricity 10.27 9.0 7.8 6.6 5.3 39.0 13%
Transport 10.91 10.1 9.2 8.4 7.5 46.1 16%
Non res bldgs 1.48 1.4 1.3 1.2 1.2 6.6 2%
Res bldgs 7.04 6.5 6.0 5.5 5.0 30.0 10%
Industry 7.05 6.5 6.0 5.5 5.0 30.0 10%
Agri 23.10 22.1 21.1 20.1 19.1 105.5 36%
Other 1.67 1.6 1.4 1.3 1.2 7.2 2%
LULUCF* 7.77 6.9 6.1 5.3 4.4 30.5 10%
Other savings 0.0 0%
Total 69.29 64.1 59.0 53.9 48.7 295.0

Second carbon budget 2026-2030

2026 2027 2028 2029 2030 Sectoral emissions ceiling % share of carbon budget
Electricity 4.9 4.4 3.9 3.5 3.0 19.7 10%
Transport 7.2 6.9 6.6 6.3 6.0 33.1 17%
Non res bldgs 1.1 1.1 1.1 1.0 1.0 5.3 3%
Res bldgs 4.8 4.6 4.4 4.2 4.0 21.9 11%
Industry 4.8 4.6 4.4 4.2 4.0 21.9 11%
Agri 18.7 18.4 18.0 17.6 17.2 89.9 45%
Other 1.2 1.1 1.1 1.0 1.0 5.5 3%
LULUCF* 4.3 4.3 4.2 4.1 4.0 20.9 10%
Other savings -1.7 -2.6 -3.6 -4.6 -5.7 -18.2 -9%
Total 45.3 42.7 40.0 37.4 34.5 200.0

I don’t want to provide too much commentary and rather focus on providing data here but in case it isn’t obvious, the reason why the percentage annual reductions need to be higher in the first carbon budget period is because we’ve already had (provisional) results from the first year in the budget, these results showed emissions in most sectors going up over the previous year, so we need to make higher reductions in four years to make up the average needed over the five year budget.

How these values were extrapolated

1. LULUCF (Land Use, Land Use Change and Forestry)

The government announcement said that “Finalising the Sectoral Emissions Ceiling for the Land-Use, Land-Use Change and Forestry (LULUCF) sector has been deferred for 18 months to allow for the completion of the Land-Use Strategy” however the announcement provided for the 2030 targets for all other sectors plus an unallocated 5.7 Mt of savings, so a simple subtraction against 34.5 Mt (representing a 51% reduction over 2018) total emissions reveals a total of 4.0 Mt remaining for LULUCF in 2030. It should be noted that the starting figure for LULUCF in 2018 is 6.8 Mt under AR5 according to the EPA, 2 tonnes more than the 4.8 Mt net LULUCF used in the climate change advisory council carbon budgets document (which was also applied using AR5 multipliers, it is not clear where the differences arise).

2. Straight line reductions from 2021 to 2030

The first pass involved a straight line reduction in each sector to 2030, reducing by the same amount every year, and the unallocated savings also increasing in a straight line between 2026 and 2030.

3. Application of the first carbon budget

Adding up the total emissions from each sector for the first carbon budget 2021-25, showed that the straight line approach was resulting in total emissions of 312.9 Mt, nearly 18 Mt over our first carbon budget amount of 295 Mt. To stay within carbon budget, the 2025 targets were revised down proportionally and then a straight line reduction was made between 2021 and 2025. The 2025 targets were reduced until the total emissions 2021-5 were 295 Mt, the total allowable carbon budget.

4. Application of the second carbon budget

Straight line reductions between the new 2025 targets and 2030 showed that we were now slightly under budget for the second carbon budget, at 197.8 Mt instead of 200 Mt. To provide a rough reduction I just reduced the unallocated savings from 2026 to 2029. This could have been smoothed out better.

5. Caveats

These figures are a prediction. The shape of emissions reductions within each carbon budget period could be different to what is presented. Also it may well be that different sectors perform differently between carbon budgets: for example electricity might proportionally reduce more over the first budget, and transport over the second, or vice versa. Some sectors will experience a rise in emissions before a fall.

LULUCF is the greatest source of uncertainty, given the significant change in the 2018 baseline between the carbon budgets technical document and the latest EPA inventories. It should be noted that the carbon budgets technical report gave the first carbon budget total excluding LULUCF as 271 Mt, my figures give a total of 264.5 Mt for the same period, a difference of 6.5 Mt. For the second carbon budget my figures excluding LULUCF give 197.3 Mt, the carbon budgets a figure of 188 Mt, a difference of 9.3 Mt.

I may have well made some arithmetic or transcription errors, feedback welcome. All figures are taken from either the government’s statement on 28th July or the EPA’s provisional 2021 emissions figures: in other words all numbers and assumptions are from public data. Inconsistencies in number precision are because I took figures from the government publication first, then backfilled missing data from the EPA national inventories. All numbers are on an AR5 basis. Full LULUCF has been included. I’m happy to email the spreadsheet to anyone who wants it.

A smart bird box to measure traffic and air quality

Cities need good data. I helped Breandán MacGabhann set up the software for his air quality monitors around the city (you can check the readings out on Twitter – mine is on the Dock Road). Councillor Brian Leddin recently asked at a council meeting how many traffic counters were around the city – the answer was only three. We’ve a transport strategy coming up, a controversial incinerator planned for the outskirts of the city: wouldn’t it be great if we had more data to back up our decisions?

I’ve been thinking about this for a while but I lack the time to put it together – I wanted to write it down in case someone else was inspired to put something similar together.

Enter the Smart Bird Box

I’ve been following various attempts to measure air quality and traffic using the Raspberry Pi hobbyist computer. I think with recent advances in machine learning and solar power that it’d be possible to deploy a network of smart sensing devices that could measure traffic flow and air quality at various points around the city. The cost would be a fraction what commercial sensors currently cost. The data that they produce could be open to the public.

The enclosure

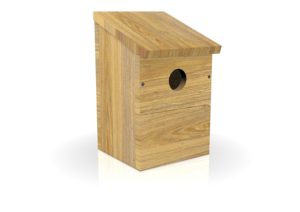
bird box
This costs less than €10 from B&Q

I think a bird box would be perfect for this. They are cheaply available and designed to be weatherproof. And they would also be handy for birds to nest in!

The power

A system would need to run without power. Solar panels on the roof of the bird box coupled with a battery pack would allow the system to run without mains power. The PiJuice project supplies panels and batteries that would be suitable for this.

Air quality sensors

Breandán has sourced relatively cheap sensors for temperature, humidity and particulate matter (). A NOx sensor could also be added.

Measuring traffic

Courtesy of Nathan Rooy

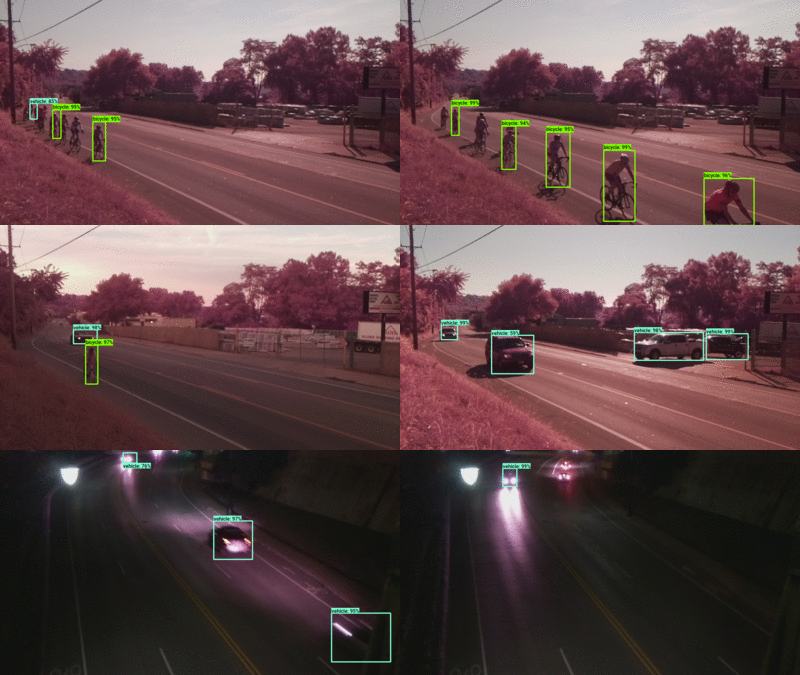
Using a raspberry pi camera, machine learning could be used to detect how many cars, trucks, bicycles and pedestrians are passing. This article describes such an approach. Traffic counts could be recorded every five minutes. It’d make a great introductory machine learning project if someone was interested in messing around with TensorFlow.

Uploading data

The system could incorporate a GSM modem to upload the data it records every hour to a server. Or if there was a nearby wifi network with a friendly owner, our bird box could connect to that. A server script could dump the data into a database, and offer a way to request data for different time ranges. The system doesn’t need to be complicated.

Not forgetting the birds!

A second infrared camera could be added to record images of any nesting birds who chose to make our nesting boxes their home.

Privacy

The bird box would be recording images but would not be storing them, the machine learning would be on the device and in real time. Source code could/should be open sourced and auditable.

Baby steps

I’m describing a complete, standalone, remotely monitorable system. But really the way to start would be to find a place where power and wifi could be delivered with a view onto a busy street. My balcony overlooks the Dock Road in Limerick and I’d be happy to open it up to hackers.

Cost

Here’s a rough estimate of the hardware cost per box.

Bird box: €5

Power management: €60 for controller, €30 for battery, €90 for solar panels

Raspberry pi: €40

Sensors: particulate matter €20, temperature/humidity €5, NOx €10

Cameras: €30 each

Modem: €80

Total: €185 if power and wifi available, an extra €260 for solar power and cellular access. Plus top-ups for the sim card.

Please get in touch if you’d be interested in working on this!

Irish Population change 2006-2016 by area

The preliminary Census 2016 results were released today. Exciting times for data nerds like me!

The CSO published changes showing population changes since the last census, showing that the population had grown everywhere in the country apart from small decreases in Mayo, Sligo and Donegal of -0.2%, -0.1% and -1.5% respectively. I thought it would be more interesting to look at population changes over two census periods, i.e. 2006-2016.

The table below shows population change in each area between 2006 and 2016. Limerick City was the only area to show a decrease, with the population changing by -2.5% compared to a national increase of 12.2%.

Table and CSV file link below. Note that the Limerick City boundaries correspond to the historical (pre-local authority merger) boundaries of the city, but includes the addition of the Limerick North Rural electoral division.


2006 2011 2016 Ch 06-16 %ch
Carlow 50349 54612 56875 6526 13.0%
Dublin City 506211 527612 553165 46954 9.3%
Dún Laoghaire-Rathdown 194038 206261 217274 23236 12.0%
Fingal 239992 273991 296214 56222 23.4%
South Dublin 246935 265205 278749 31814 12.9%
Kildare 186335 210312 222130 35795 19.2%
Kilkenny 87558 95419 99118 11560 13.2%
Laois 67059 80559 84732 17673 26.4%
Longford 34391 39000 40810 6419 18.7%
Louth 111267 122897 128375 17108 15.4%
Meath 162831 184135 194942 32111 19.7%
Offaly 70868 76687 78003 7135 10.1%
Westmeath 79346 86164 88396 9050 11.4%
Wexford 131749 145320 149605 17856 13.6%
Wicklow 126194 136640 142332 16138 12.8%
Clare 110950 117196 118627 7677 6.9%
Cork City 119418 119230 125622 6204 5.2%
Cork County 361877 399802 416574 54697 15.1%
Kerry 139835 145502 147554 7719 5.5%
Limerick City 59790 57106 58319 -1471 -2.5%
Limerick County 124265 134703 136856 12591 10.1%
North Tipperary 66023 70322 71370 5347 8.1%
South Tipperary 83221 88432 89071 5850 7.0%
Waterford City 45748 46732 48369 2621 5.7%
Waterford County 62213 67063 68032 5819 9.4%
Galway City 72414 75529 79504 7090 9.8%
Galway County 159256 175124 179048 19792 12.4%
Leitrim 28950 31798 31972 3022 10.4%
Mayo 123839 130638 130425 6586 5.3%
Roscommon 58768 64065 64436 5668 9.6%
Sligo 60894 65393 65357 4463 7.3%
Cavan 64003 73183 76092 12089 18.9%
Donegal 147264 161137 158755 11491 7.8%
Monaghan 55997 60483 61273 5276 9.4%
State 4239848 4588252 4757976 518128 12.2%

CSV file link


Where in Ireland has the most pubs per person?

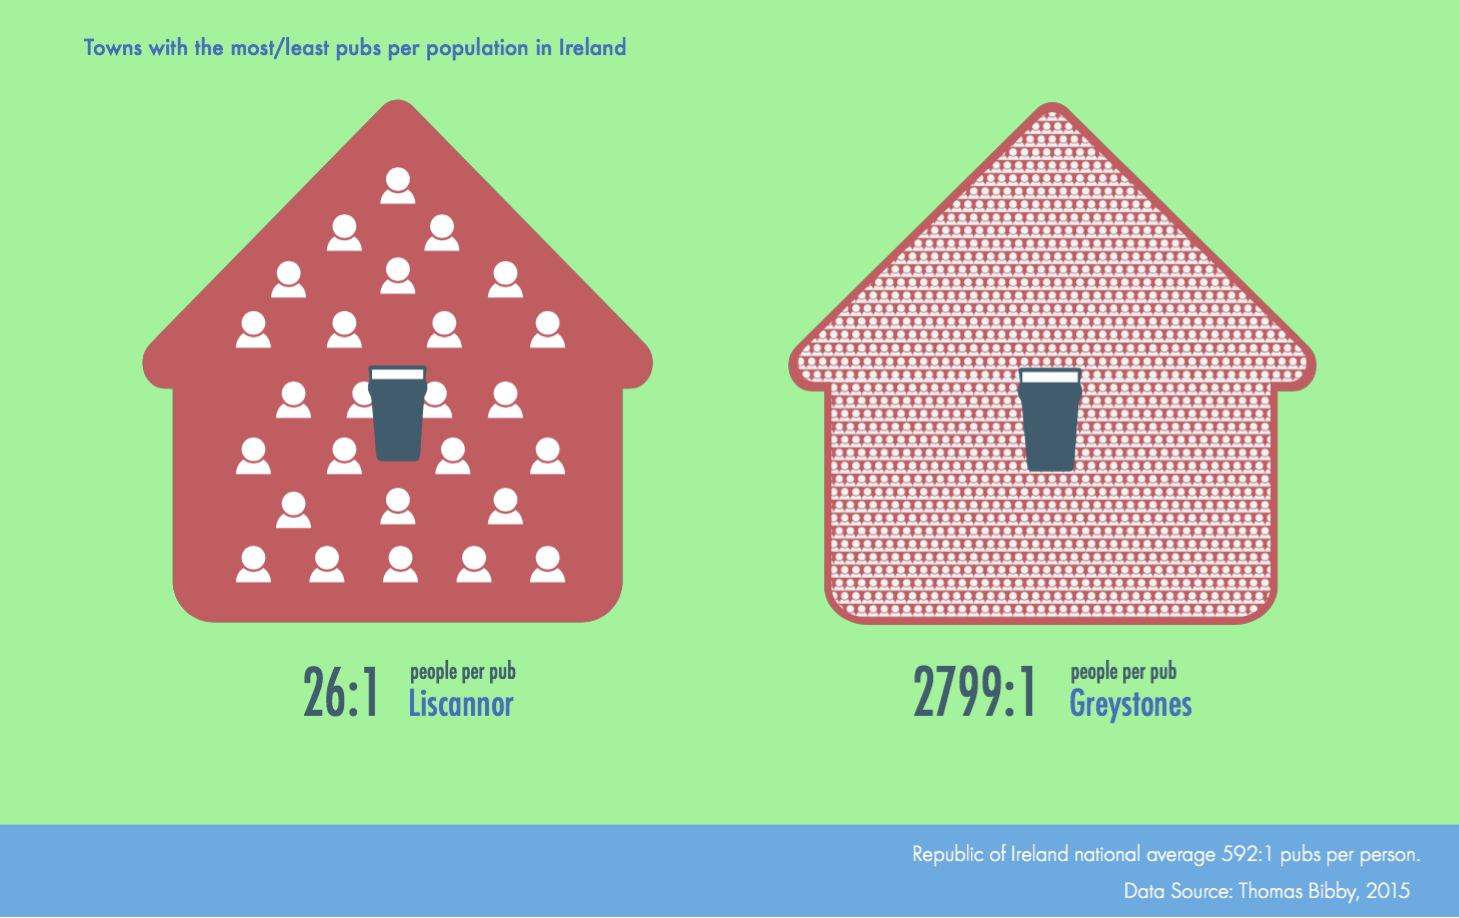
pubs2If you’re in a hurry, the answer is Liscannor, Co. Clare.  5 pubs for 129 people, or 1 pub for every 26 people. And on the other extreme, the town in Ireland with the fewest pubs is Greystones, with 4 pubs for 11,194 people, or 1 pub for every 2799 people.

The wonderful infographic was made by my friend Gimena who is an extremely talented interface designer – check out her portfolio.

There’s a lovely cycleway called the Great Southern Trail in County Limerick, and we cycled the western end of it a few weeks ago, ending in Abbeyfeale, a small town on the Limerick/Kerry border.  Growing up down the road in Adare, I remember people claiming that Abbeyfeale had the most pubs per head in Ireland.  Walking round in search of a pint to reward my cycling efforts I wondered, was this true? Barstool talk was all we had in the nineties, but surely someone had done a bit of a study since.  A half an hour of web searching later, all I could come up with was a few forum posts essentially containing the same barstool talk as I’d come across before.

Cycling back I had a bit of time to think about this.  I knew the Central Statistics Office (CSO) had the population of each town, but how to get a list of pubs?  I had been looking for an excuse to fool around with a bit of Python, and this seemed like the perfect chance to write a small web scraper to get the data.  There is a Vintner’s Association of pubs which had a membership list, and the Golden Pages (our equivalent of the Yellow Pages) had a pretty comprehensive list of businesses with a landline (every business with a landline gets a free listing).

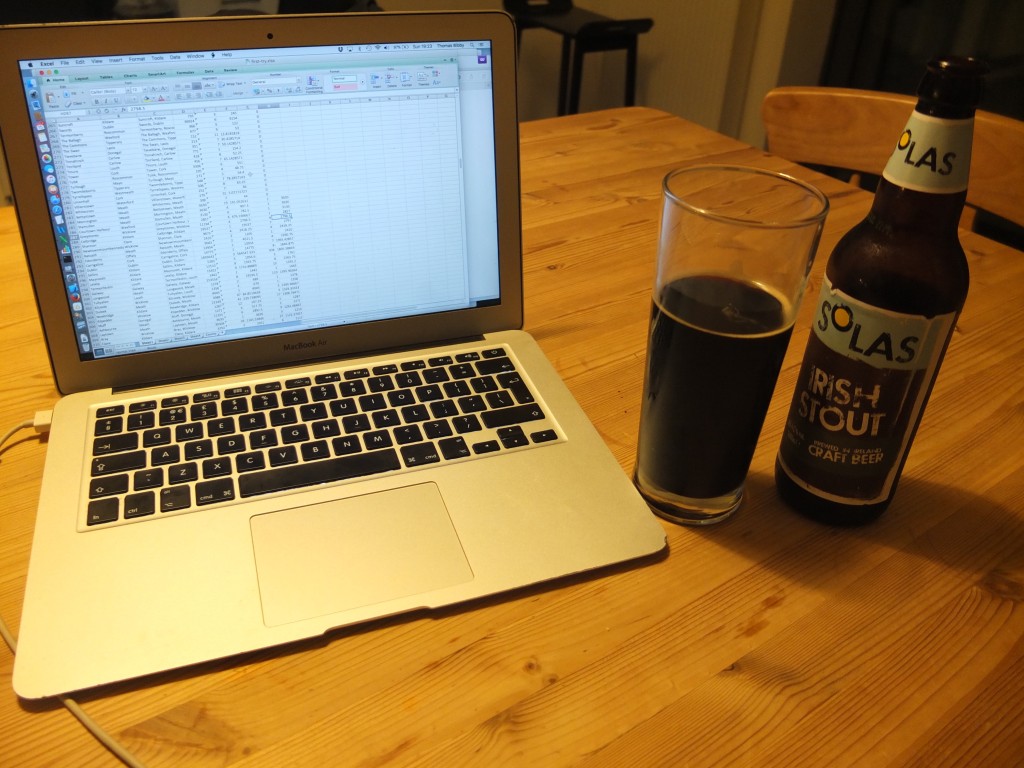
I was all ready to write my little scraper when my friend Emmet pointed out that because running a pub is a licenced business, there was probably a public list, and there was, on the Revenue Commissioner’s site.  It was even available as an Excel file, with the address lines in separate columns!  My excitement quickly waned as I waded through the horrible morass that is Irish addresses.  My original idea was to get the data into a database so I could do some fun analysis – now I was definitely stuck in Excel as this job was 95% cleaning data. Fortunately I managed to harangue Emmet into helping me with some Excel tips and tricks.

I was reminded why we have the most amazing national statistics office here in Ireland.  Not only because they are unfailingly helpful whenever I have had cause to contact them over the years (not wanting to indulge in waste of taxpayer’s money I decided not to contact them asking for help with this particular project).  But mostly because we in Ireland are an absolute mess when it comes to addresses.  How the CSO manage to count anything in this country is a mystery.  Not only until this year we were one of the only rich countries not to have a postcode system, but consider the following points when I was cleaning up the pub data:

  • Irish is our first official language, so every address has two completely separate legal forms, both of which are equally valid.
  • Either the Irish or the English name is picked as the ‘official name’, but this has little to do with what is used in reality.
  • Dingle is officially (and slightly controversially) ‘An Daingean’ because it is part of the Irish-speaking Gaeltacht.  Yet all 38 pubs use ‘Dingle’ as their address.  Maryborough is listed as the English language equivalent of Portlaoise (not in an Irish speaking area), yet all 34 pubs use the Irish form
  • Many places cannot even agree with themselves how they are spelt.  There are 9 pubs in Louisburgh, Mayo, yet 4 spell it ‘Louisbourgh’ and one other spells it ‘Louisburg’
  • 3 pubs in Co. Limerick are in ‘Dromcollogher, 2 are in ‘Drumcollogher’, yet some of the signs on the way in to town say ‘Dromcolliher’
  • Pubs in Roosky put their address down as Roosky, Carrick-on-Shannon, Co. Roscommon.  No matter that Carrick-on-Shannon is in Co. Leitrim, that’s where their local post office is.  But I was getting a few pubs in Carrick-on-Shannon, Co. Leitrim and a few in Carrick-on-Shannon, Co. Roscommon, and they all had to be cleaned up. This is surprisingly common.
  • Sometimes locals completely ignore the official spelling for their town, for example Pallas Grean in Co. Limerick vs. Pallasgreen.
  • Many of our towns have boundaries defined in Victorian times.  For consistency, these populations are listed separately.  So there are rows upon rows of separate population entries for ‘Loughrea Legal Town’ and ‘Loughrea Environs’
  • We don’t even have a good definition for what a town is.  The CSO have their own definition, which must be a huge amount of work for them: a census town “is defined as being a cluster with a minimum of 50 occupied dwellings, with a maximum distance between any dwelling and the building closest to it of 100 metres, and where there was evidence of an urban centre (shop, school etc)”

After a large amount of address-wrangling, I got my data cleaned up somewhat.  I discarded all the local authority subdivisions of Dublin to just cater for one county of Dublin.  Out of 7,745 licenced pubs and hotels in Ireland, I managed to match up all but 990 of them to a census town, and many of these would not have a match anyway (e.g. if their address was listed as a suburb of a bigger town, like Mahon in Cork, or if they were in a settlement too small to be considered a census town)

The raw data gave the top 10 as follows:

Town Population Number of pubs Number of people per pub
Feakle, Clare 113 7 16.1
Liscannor, Clare 129 7 18.4
Lifford, Donegal 1658 55 30.1
Waterville, Kerry 232 7 33.1
Doonbeg, Clare 272 8 34.0
Castlegregory, Kerry 243 7 34.7
Cong, Mayo 178 5 35.6
Knocktopher, Kilkenny 144 4 36.0
Ballyvaughan, Clare 258 7 36.9
Sneem, Kerry 258 7 36.9

Yet it was ultimately Liscannor, and not Feakle, that I judged the winner of my ‘most pubs per capita’ award. The answer again comes down to post office locations: in rural Ireland the second-last line of your address is normally your local post office.  So even though 7 pubs had Feakle as their address, at least 3 were a long way outside Feakle in another village.  But second on my list was Liscannor: even though 2 of its 7 pubs were a small way outside near St. Bridget’s Well on the way to the Cliffs of Moher, 5 hostelries (4 pubs and 1 hotel) were definitely within the small village of 129 people, giving an incredible ratio of 1 pub for every 26 people.

Legitimate data analysis tools

I gave up at this point, satisfied that I had my winner.  But I was a bit sorry I didn’t get the data cleaned up a bit more – in particular 3rd place Lifford with an incredible 55 pubs for under 1700 people sounded fascinating – but my lack of knowledge about Donegal local geography prevented me from cleaning the data much further (I suspect some of these 55 pubs were in villages outside of Lifford).

I’ve provided the cleaned data files for both towns by population and pubs by address in case anyone else wants to have a go.  The two files can be joined in a spreadsheet with a simple COUNTIF statement or similar. I’m not sure about the copyright status of either file, the pubs file is based on publicly available data about commercial businesses, and equally the CSO data is publicly available, but I’m not sure under what licence.  Any changes I have made to the original data you may use in the spirit of finding a good place to go boozing.

Original data sources: