The National Transport Authority released a National Fares Strategy summary document on 27 April 2023, which indicates the approach that will be taken to calculating fares for rail and bus services outside the Dublin metropolitan area in the future. Fares will be calculated according to a simple formula:
Fare = Boarding Charge + Distance [as the crow flies] Based Fare
To help illustrate this, I’ve put together a calculator for intercity rail journeys. You can change the value for the boarding charge and the distance based fare and see how fares compare to the existing cash fare. Fares are taken from the Rail Users Ireland Irish Rail Fare Calculator and represent the maximum fare payable: cheaper fares are often available online and the National Fares Strategy document has indicated that this will continue to be the case. Distances (as crow flies) from the Google Maps API.
To be clear I have no insight into what the boarding charge or distance based fare will be, and the defaults here are chosen fairly randomly. I just thought it’d be interesting to put together a tool to illustrate what the potential impact on specific journeys would be.
Feel free to contact me if you’d like more journey pairs added to the table or if you see any errors.
Change the values and hit recalculate to see updated new fares and % change in the table below:
Boarding charge (in cent):
Distance based fare (cent per km [as crow flies]):
Thank you for the opportunity to make a submission on the Proposed Traffic Calming Measures on Pearse Street, Mitchel Street, Emmet Place, Kickham Street and Silver Street, Nenagh, which I make in a personal capacity.
I would like to welcome the proposed raised zebra crossings as part of this scheme. I believe their introduction will result in an improved walking environment in the centre of Nenagh. As a compact thriving town which has the potential to grow and thrive over the period of the new County Development Plan Nenagh has an exciting future ahead of it and the focus on the four streets that serve as the central circulation route for people who walk, cycle, take public transport and drive through Nenagh is welcome. Unfortunately there was no rationale provided for this scheme, only a series of drawings; and any plans proposed under previous County Development Plans to change traffic circulation in Nenagh are no longer available online to the public. I have some reservations about the increase in capacity for private vehicles in the centre of Nenagh that will result from this scheme, and the compatibility of this scheme with statutory plans, which I have detailed below.
Premature introduction of this scheme ahead of Nenagh Local Transport Plan
I took part in the survey last year, which invited input ahead of “delivery of a Local Transport Plan for Nenagh will identify the key infrastructural requirements of the Town and prioritise the transport interventions required in the plan area as the Town grows and develops over the next 10 years”. At the time of the consultation last year, there was a commitment to publish a draft Local Transport Plan for Nenagh later in 2022. While I understand that the publication of the draft plan has been delayed, I suggest that this scheme is premature as it will define private vehicle traffic flows through the centre of Nenagh. Pausing this scheme to take account of an agreed Local Transport Plan, as recommended in the Regional Spatial and Economic Strategy for the Southern Region, would allow any scheme to change traffic flows in the centre of Nenagh (which have been unchanged since Kickham Street was the main road for traffic from Limerick, Clare, Kerry and North Tipperary to Dublin) to be supported by best practice and the provisions of the County Development Plan.
Compatibility with Tipperary County Development Plan 2022-2028
Modal shift targets [County Development Plan Policy 12-1 (a)]
(a) Support the achievement of the modal shift targets set out in Table 12.1 Modal Share Targets to apply to Tipperary, and require new development to demonstrate and ensure that land-use, connectivity and transportation are integrated in a manner which reduces reliance on car-based travel, promotes more sustainable transport choice, and co-ordinates particular land uses with their accessibility requirements.
It is not clear how this scheme is compatible with the latest adopted Development Plan for County Tipperary. The scheme will result in an increase in capacity for vehicles travelling through Nenagh town centre, and there is no provision for cycle facilities in the scheme. This appears to be in conflict with the modal shift target in Table 12.1 of the Development Plan which seeks to reduce the modal share of trips by car and van from 71% to 45% and to increase the modal share of trips by bicycle from 0.76% to 10%. Nenagh is Tipperary’s second largest town and if no provision is made for segregated cycling infrastructure in the middle of the town, it is difficult to see how this is compatible with the County Development Plan.
Design Manual for Urban Roads and Streets and National Sustainable Mobility Policy [County Development Plan Policy 12-1 (b)]
(b) Apply the principles of the National Sustainable Mobility Policy (DoT, 2022), the Design Manual for Urban Roads and Streets (DTTS and DHPLG, 2019) and the Design Manual for Urban Roads and Streets Interim Advice Note – Covid-19 Pandemic Response (2020).
The Design Manual for Urban Roads and Streets (DMURS), adopted in the development plan, specifically cautions against one-way systems like the one proposed in this scheme:
One-way streets have also been widely implemented, retrospectively, in order to filter vehicle permeability and relieve traffic congestion. The use of one-way systems for traffic management should also be approached with caution by designers as they:
Promote faster speeds as drivers are likely to drive faster when no risk is perceived from oncoming traffic.
Will result in longer vehicular journeys, including those for cyclists and public transport.
Can be confusing for users when they deflect people away from destinations.
Require additional signage.
Conversion to one-way systems may be beneficial on narrow carriageways where the street reserve is limited in order to provide additional space for pedestrians, cyclists and other public realm improvements. Counter flow cycle lanes should also be considered in order to maintain permeability for cyclists Examples include Centres where the implementation of a one-way system has direct placemaking benefits as it allows for additional footpath width and/or on-street parking (see Figure 3.24).
The proposed scheme proposes no reallocation of road space to more sustainable modes and there is no evidence that consideration has been made to provide additional space for pedestrians, cyclists and other public realm improvements. Examples exist in other local authority areas where Section 38 of the Road Traffic Act has been used to reallocate road space away from the private car towards walking and cycling.
It is a specific aim of the National Sustainability Policy to reallocate road space in urban centres away from the private car towards more sustainable modes: “rebalancing transport movement in metropolitan areas and other urban centres away from the private car and towards active travel and public transport.” It is difficult to see how the implementation of this scheme as proposed is compatible with this aim.
Integrated pedestrian and cycling networks and infrastructure [County Development Plan Policy 12-1 (c)]
(c) Development proposals shall be required to provide for well-integrated pedestrian and cycling networks and infrastructure, such as cycle parking, as part of their planning application and ‘Sustainability Statement’, where applicable, the development management standards Volume 3 will apply.
The draft CycleConnects Network published by the National Transport Authority included both an interurban cycle network throughout County Tipperary and a series of urban cycle networks for towns in the county, including Nenagh. The proposed scheme includes streets that are part of the proposed network: Pearse Street and Mitchel Street are designated as primary cycle routes (in red), and Emmet Place and Kickham Street are designated as secondary cycle routes (in blue). Without cycle infrastructure on these streets which represent key destinations in the centre of Nenagh, it is difficult to see how Nenagh can support a quality cycle network as envisioned under CycleConnects and supported by the Tipperary County Development Plan.
Accessibility for people with disabilities [County Development Plan Policy 12-1 (d)]
(d) To apply a ‘whole journey approach’ to make public transport fully accessible to people with disabilities’, this refers to all elements that constitute a journey from the starting point to destination including footpaths, tactile paving, cycle paths, roads, pedestrian crossing points, town greenways and bus stops/shelters in line with relevant Guidance from the Department of Transport.
The inclusion of bollards in the new proposed bus stop on Pearse Street are a cause of concern. Specifically, the bollards will restrict the approach of buses to the bus stop and in the event of obstructions or existing buses being stopped at the bus stop, may prevent low-floor buses from pulling up at the kerb in a manner that will enable the deployment of a ramp to assist people with disabilities to board or leave their bus. It is strongly recommended that these bollards are omitted from the plan as they may result in a reduction in accessibility for people using public transport to and from Nenagh.
The maintaining of the narrow footpath width on Emmet Place at less than 1.8m is below the minimum mandated by DMURS, which states that 1.8m is the minimum width necessary to allow two standard wheelchairs to pass each other. It is not clear whether there is room on Emmet Place to accommodate two lanes of traffic and cater for a minimum footpath width, never mind a greater width more appropriate for an urban centre close to many trip destinations.
Thank you for the opportunity to make a submission on the proposed BusConnects network for Limerick City, which I am making in a personal capacity. I’d like to compliment the project team on how they have run this consultation, in particular the wide range of materials produced, the in-person and online consultation events which provided an opportunity for people to learn more and feed back their suggestions. The use of Irish Sign Language interpreters at two of the in-person events is an initiative that is particularly welcome.
I’d like to express my broad support for the BusConnects network for Limerick, the increased frequency and coverage will make Limerick a better place to live, work and receive an education. With associated infrastructural changes, this network plan provides the basis for the bus to become the main form of transport for many people across the city, instead of a last resort option taken by those who have no other choice.
Schaffhausen, Switzerland (pop. 37k)
There is one area for improvement that I would like to highlight, and that is the lack of integration between the proposed routes, and in particular the decision to route two of the four high-frequency routes away from the main bus and rail station on Parnell Street.
I believe this arrangement is not consistent with bus networks in other small European cities with bus modal share far in excess of the modal share in Limerick. I have given three examples together with route network maps in this document.
In these examples, all significant bus routes interchange at the train station. It should be noted that in these examples the train stations are also slightly peripheral to the city centre, as is the case in Limerick.
Having all routes meet at the train station would offer interchange from and to a single bus route to:
Other city routes
Dunquerque, France (pop. 87k)
Rural bus routes including those delivered under the National Transport Authority’s Connecting Ireland programme, which represents the largest increase in rural public transport in Ireland in decades
Intercity Expressway bus routes to Cork, Galway, Waterford, Killarney, Tralee and further afield
Intercity train services to Dublin, Cork, Galway and Castleconnell/Birdhill/Nenagh/Cloughjordan/Roscrea
Having all routes meet at a single point would offer crucial legibility to the city bus network, where passengers could be confident that they can transfer to any route by going to a single transfer point.
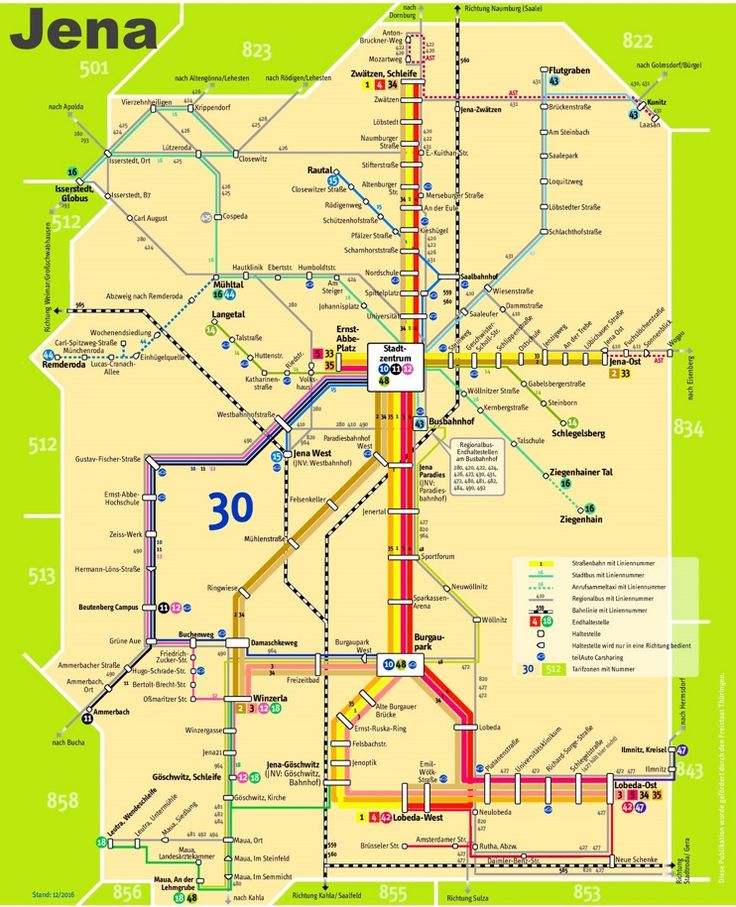
Jena, Germany (pop 111k)
The only significant Transport-Oriented Development scheme planned for Limerick City is the scheme proposed by the Land Development Agency (LDA) around Colbert station, which the LDA has estimated could produce 2,800 residential units. It is appropriate to serve such a site with all the high-frequency city bus routes given the proposed population size and density.
Serving the bus and rail station need not need a large detour for buses.For example, changing the path of route 4 involves a very small increase in route distance as can be seen in the diagram below. If route 4 was routed via Mulgrave St and Childers Rd as the current 304 is (and which would offer greater road width for bus segregation), the route via the station would be even shorter than a route serving O’Connell St.
In conclusion I would once again like to welcome the proposed network, and to express my support for a small tweak to routes 2 and 4 so that they could directly serve Colbert Station.
Three years ago, I wrote an article describing how excited I was to be starting a Masters in TU Dublin. I thought it would be interesting to review my experience after finishing the course, in the hope that it might be useful to people who were thinking of applying. I’m told there might be one or two places remaining for the January 2023 intake if you are quick (apply here).
Classmates
I appreciate this is a variable factor but by far the best aspect of the course for me was working with my fellow students on the course. There was a fairly good mix of gender and age, and we were a mix of people working in the private sector, the public sector, and those of us from more diverse employment backgrounds who were coming from an activist background. Most modules contained quite a lot of group work and we quickly got to know each other well, with an active and sometimes raucous WhatsApp group discussing not only upcoming deadlines but general transport developments both in Ireland and further afield. I think we all learned a lot from each other and we’ve continued to meet semi-regularly since graduating.
Broad range of modules
The range of modules we studied was vast, ranging from the social science of behavioural change, to architecturally-related placemaking, to the sometimes challenging maths of transport modelling. It really is a well-rounded course and no matter what your academic background you will find some modules relatively familiar and others unlike anything you’ve studied before.
The importance of transport and mobility
During the course I was frequently reminded of how relevant our subject matter was to important and current issues in policy, which was a definite advantage for me as I was working in politics for most of my time on the course. In particular, challenges in climate, health and social equity. It felt like we were going to graduate with an awful lot of really useful tools to solve policy problems that many feel are relatively intractable.
Influential lecturers
Over the two years that I was studying on the course, at least 6 of my lecturers appeared in front of various Oireachtas committees: Lorraine D’Arcy, Dave O’Connor, Odran Reid, Suzanne Meade, Helen Murray O’Connor and Sarah Rock. I think this is evidence of the esteem that our lecturers were held by policymakers and it felt good that politicians were getting the same exposure to good practice as we were.
Dissertation
For many of us, the dissertation was the most challenging part of the Masters. We were all busy people with jobs and families and it was a challenge to fit in enough time for original research. I did struggle at times to keep going with my dissertation and I’m certainly grateful to Rose Anne for putting up with me as I got ever more grumpy towards the deadline, but I did submit on time, and I was fortunate enough to have a paper on my research accepted to the Irish Transport Research Network Conference (Public transport deprivation in County Limerick and the development of an effective rural public transport network – PDF), this paper was also covered on the front page of the Irish Examiner.
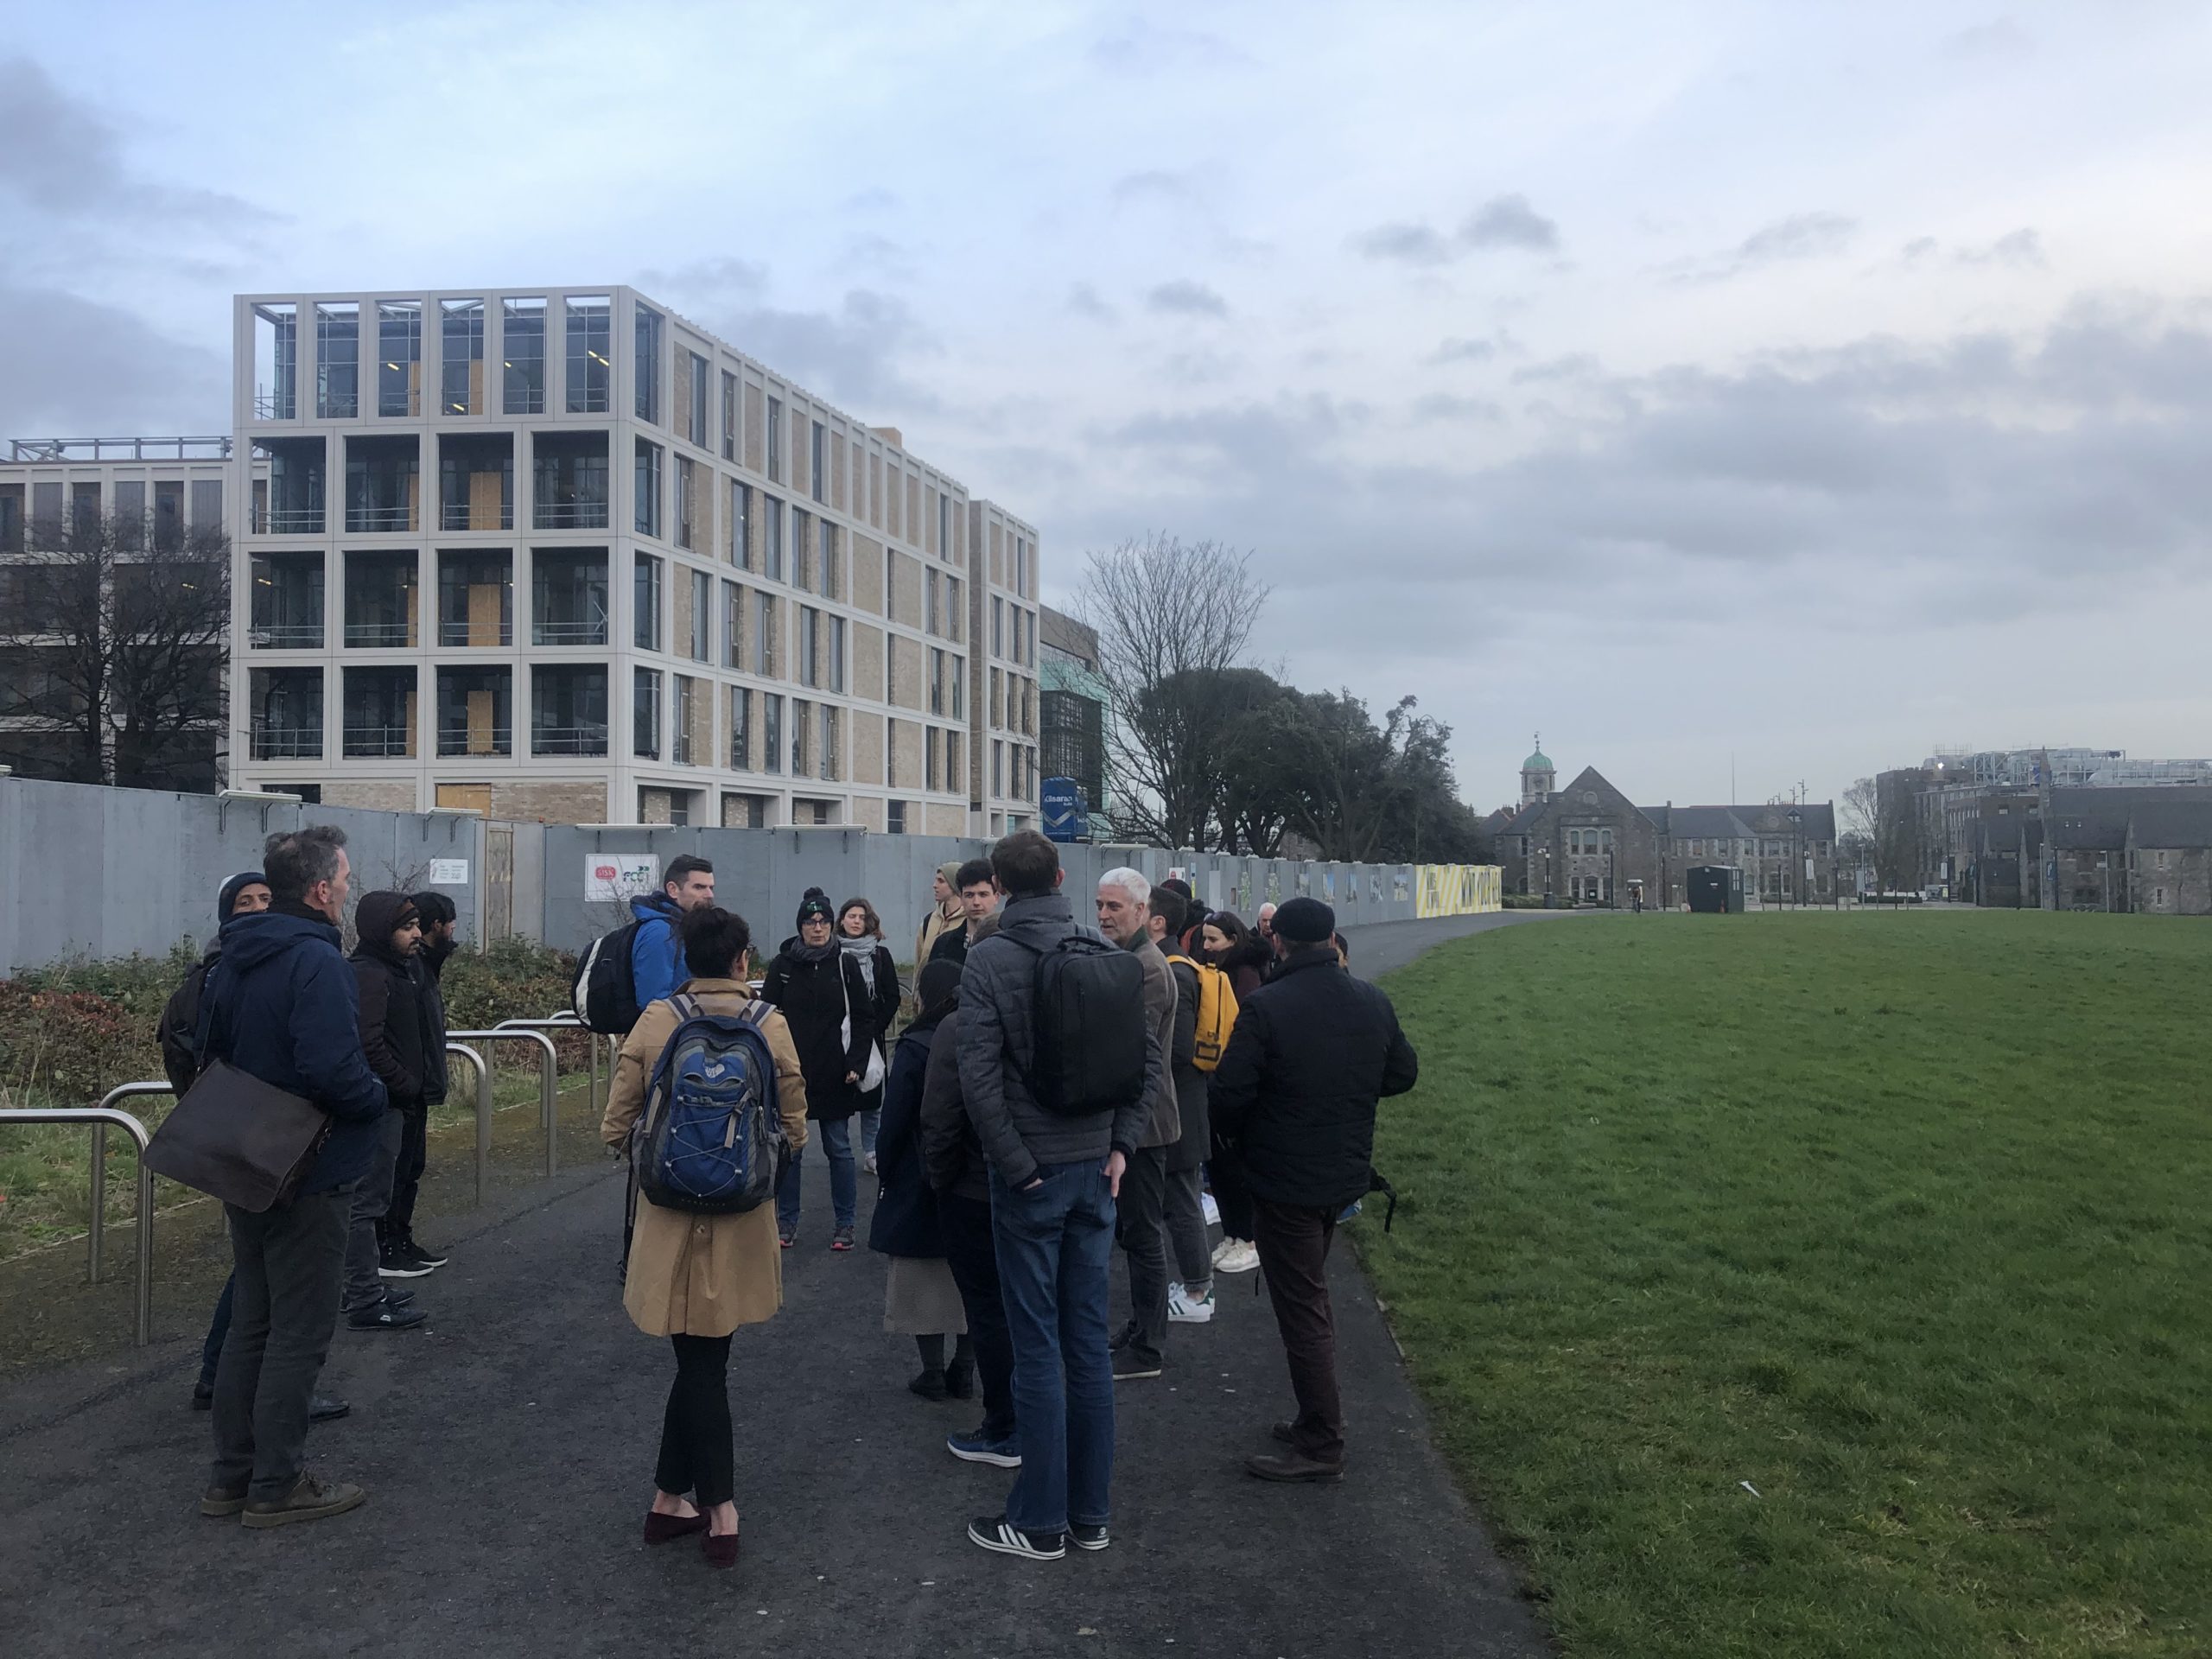
Summer School
Despite Covid restrictions we did get to have an in-person summer school: ours was hosted by Dún Laoghaire Rathdown County Council and it was fun to have our proposals to extend the famous Coastal Mobility Route assessed by Conor Geraghty and Robert Burns. We also had a guest input from one of the lead authors of DMURS.
Should you do this course?
In a word, yes! If you care about problems that matter and don’t mind having your brain slightly melted at their complexity, this is the course for you. It’s a course that’s fundamentally about people, and it is key to solving the singular challenge of our age: the climate crisis. I’m more than happy to chat to anyone considering applying for this course (contact details here) and it has certainly changed my outlook on life.
The twin towns of Killaloe and Ballina are served by the 345 service from Limerick to Scariff via Killaloe, and the 323 service from Limerick to Nenagh via the University of Limerick and Ballina.
Here is a summary timetable for travelling to/from Limerick to Killaloe by public transport. The service has expanded significantly with 12 buses each way per day Monday to Saturday, up from 3 buses each way in 2020 with no weekend service.
I would like to suggest a new 06:00 service from Dublin Heuston to Cork Kent with a connecting service arriving at Limerick Junction from Limerick. These services would allow passengers from Dublin and Limerick to arrive in Cork before 9am.
A suggested timetable is listed below. I do not believe it would conflict with any existing or proposed train paths.
Summary: to stay within our carbon budgets, we may need to reduce electricity emissions by as much as 16% a year, transport emissions by 9% a year, and agriculture emissions by 5% a year between 2022 and 2025 to stay within our first carbon budget. There are quite a few caveats with this data, primarily relating to LULUCF (Land Use, Land Use Change, and Forestry) emissions, detailed at the end of the post, and it is possible I have underestimated the first carbon budget by 6.5 Mt and the second carbon budget by 9.3 Mt, due to the changes in the baseline for LULUCF emissions. However I think it’s important to discuss possible emissions trajectories as early as possible in the carbon budget period if we are to be successful in staying within that budget.
On Thursday 28th July, the government announced sectoral emissions targets for 2030. Essentially these are the emissions each sector will need to emit in 2030 if we are to stay within the two carbon budgets to 2030 adopted by the Oireachtas.
Although the 2025 targets (end of the first carbon budget period) and the actual sectoral emissions ceilings were not announced last week, enough information was provided to enable a prediction of what the 2025 targets will be and how much we will need to reduce emissions in each sector each year.
Here’s the summary table for the period of the first carbon budget 2021-2025 (which we’re already in the middle of)
2025 targets
Sector
2021
2025 target
% reduction 2022-5 (4 yrs)
Annual % reduction 22-25 (4 yrs)
Electricity
10.27
5.3
48%
16%
Transport
10.91
7.5
31%
9%
Non res bldgs
1.48
1.2
21%
6%
Res bldgs
7.04
5.0
29%
9%
Industry
7.05
5.0
30%
9%
Agri
23.10
19.1
17%
5%
Other
1.67
1.2
26%
8%
LULUCF*
7.77
4.4
43%
14%
Other savings
Total
69.29
48.7
30%
9%
And here’s the second carbon budget period 2026-2030.
2030 targets
Sector
2025 Mt CO2e
2030 target
% reduction 2025-30 (5 yrs)
Annual % reduction 2026-30 (5yrs)
Electricity
5.3
3
44%
12%
Transport
7.5
6
20%
5%
Non res bldgs
1.2
1
15%
3%
Res bldgs
5.0
4
19%
4%
Industry
5.0
4
19%
4%
Agri
19.1
17.24
10%
2%
Other
1.2
1
19%
4%
LULUCF*
4.4
4.0
10%
2%
Other savings
-5.7
18%
Total
48.7
31.54
29%
7%
And here are two larger tables showing actual emissions values for each year, and the totals for each carbon budget
First carbon budget 2021-2025
2021
2022
2023
2024
2025
Sectoral emissions ceiling
% share of carbon budget
Electricity
10.27
9.0
7.8
6.6
5.3
39.0
13%
Transport
10.91
10.1
9.2
8.4
7.5
46.1
16%
Non res bldgs
1.48
1.4
1.3
1.2
1.2
6.6
2%
Res bldgs
7.04
6.5
6.0
5.5
5.0
30.0
10%
Industry
7.05
6.5
6.0
5.5
5.0
30.0
10%
Agri
23.10
22.1
21.1
20.1
19.1
105.5
36%
Other
1.67
1.6
1.4
1.3
1.2
7.2
2%
LULUCF*
7.77
6.9
6.1
5.3
4.4
30.5
10%
Other savings
0.0
0%
Total
69.29
64.1
59.0
53.9
48.7
295.0
Second carbon budget 2026-2030
2026
2027
2028
2029
2030
Sectoral emissions ceiling
% share of carbon budget
Electricity
4.9
4.4
3.9
3.5
3.0
19.7
10%
Transport
7.2
6.9
6.6
6.3
6.0
33.1
17%
Non res bldgs
1.1
1.1
1.1
1.0
1.0
5.3
3%
Res bldgs
4.8
4.6
4.4
4.2
4.0
21.9
11%
Industry
4.8
4.6
4.4
4.2
4.0
21.9
11%
Agri
18.7
18.4
18.0
17.6
17.2
89.9
45%
Other
1.2
1.1
1.1
1.0
1.0
5.5
3%
LULUCF*
4.3
4.3
4.2
4.1
4.0
20.9
10%
Other savings
-1.7
-2.6
-3.6
-4.6
-5.7
-18.2
-9%
Total
45.3
42.7
40.0
37.4
34.5
200.0
I don’t want to provide too much commentary and rather focus on providing data here but in case it isn’t obvious, the reason why the percentage annual reductions need to be higher in the first carbon budget period is because we’ve already had (provisional) results from the first year in the budget, these results showed emissions in most sectors going up over the previous year, so we need to make higher reductions in four years to make up the average needed over the five year budget.
How these values were extrapolated
1. LULUCF (Land Use, Land Use Change and Forestry)
The government announcement said that “Finalising the Sectoral Emissions Ceiling for the Land-Use, Land-Use Change and Forestry (LULUCF) sector has been deferred for 18 months to allow for the completion of the Land-Use Strategy” however the announcement provided for the 2030 targets for all other sectors plus an unallocated 5.7 Mt of savings, so a simple subtraction against 34.5 Mt (representing a 51% reduction over 2018) total emissions reveals a total of 4.0 Mt remaining for LULUCF in 2030. It should be noted that the starting figure for LULUCF in 2018 is 6.8 Mt under AR5 according to the EPA, 2 tonnes more than the 4.8 Mt net LULUCF used in the climate change advisory council carbon budgets document (which was also applied using AR5 multipliers, it is not clear where the differences arise).
2. Straight line reductions from 2021 to 2030
The first pass involved a straight line reduction in each sector to 2030, reducing by the same amount every year, and the unallocated savings also increasing in a straight line between 2026 and 2030.
3. Application of the first carbon budget
Adding up the total emissions from each sector for the first carbon budget 2021-25, showed that the straight line approach was resulting in total emissions of 312.9 Mt, nearly 18 Mt over our first carbon budget amount of 295 Mt. To stay within carbon budget, the 2025 targets were revised down proportionally and then a straight line reduction was made between 2021 and 2025. The 2025 targets were reduced until the total emissions 2021-5 were 295 Mt, the total allowable carbon budget.
4. Application of the second carbon budget
Straight line reductions between the new 2025 targets and 2030 showed that we were now slightly under budget for the second carbon budget, at 197.8 Mt instead of 200 Mt. To provide a rough reduction I just reduced the unallocated savings from 2026 to 2029. This could have been smoothed out better.
5. Caveats
These figures are a prediction. The shape of emissions reductions within each carbon budget period could be different to what is presented. Also it may well be that different sectors perform differently between carbon budgets: for example electricity might proportionally reduce more over the first budget, and transport over the second, or vice versa. Some sectors will experience a rise in emissions before a fall.
LULUCF is the greatest source of uncertainty, given the significant change in the 2018 baseline between the carbon budgets technical document and the latest EPA inventories. It should be noted that the carbon budgets technical report gave the first carbon budget total excluding LULUCF as 271 Mt, my figures give a total of 264.5 Mt for the same period, a difference of 6.5 Mt. For the second carbon budget my figures excluding LULUCF give 197.3 Mt, the carbon budgets a figure of 188 Mt, a difference of 9.3 Mt.
I may have well made some arithmetic or transcription errors, feedback welcome. All figures are taken from either the government’s statement on 28th July or the EPA’s provisional 2021 emissions figures: in other words all numbers and assumptions are from public data. Inconsistencies in number precision are because I took figures from the government publication first, then backfilled missing data from the EPA national inventories. All numbers are on an AR5 basis. Full LULUCF has been included. I’m happy to email the spreadsheet to anyone who wants it.
I’d like to broadly welcome the proposal to calm traffic and provide a safer route to school for the pupils of St. Paul’s and St. Gabriel’s.
One item that may want to be considered is footpath width – it appears from the drawings that the footpath narrows to 1.6m in places. The Design Manual for Urban Roads and Streets (DMURS) notes that 1.8m is the absolute minimum for two wheelchairs to pass each other. Given the proximity of St. Gabriel’s it’d be great to have a small extension to the footpath width.
It appears that road width (excluding provision for active travel modes) has been kept to a 5.5m minimum. DMURS notes that the range for a standard carriageway width on Local streets is in the range of 5 to 5.5m. If the road carriageway width was reduced further, it would provide further width to facilitate active modes, and perhaps a different design would be possible.
I can’t help but think that a combined shared path would be better for all active modes but I think this proposal is better than leaving the street as it is.
Finally, I note one of the submissions stated that “It is not too late to put the interests and wishes of the residents first. Those who pay taxes, vote and live here 24/7/365.” I would like to respectfully disagree with that statement, I believe that providing infrastructure that would help children travel to primary school independently is the mark of a generous and civilised society, and reallocating road space to active modes of travel is an appropriate way of achieving this. Our children may not pay any taxes but we as adults have a duty to cherish and protect them so that they can lead healthy and fulfilled lives.
Given the fact that the current carriageway width of Fr. Russell Rd is 7.5m and the scheme proposes to reallocate some of this road space away from the private car, I would like to express general support for this scheme, however I believe some aspects could be improved.
Carriageway widths
From the Part 8 planning report:
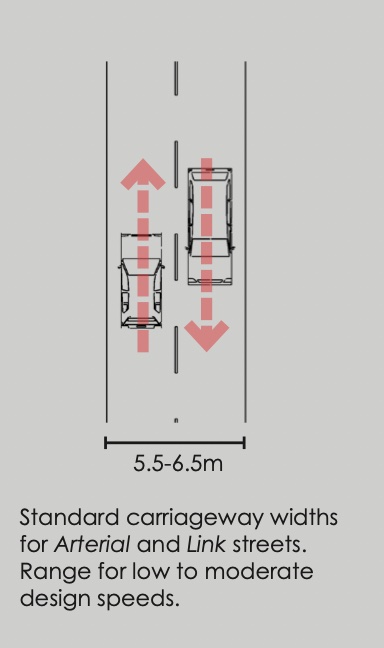
“DMURS includes guidance on carriageway widths and recommends that designers should minimise the width of the carriageway…Low to moderate speeds should be encouraged on the roadway with the recommended width in DMURS being 6 – 6.5m”
DMURS does state that the preferred carriageway width on Arterial and Link streets are 3.0m and 3.25m. However given the limited room for footpaths and cycle lanes on Fr. Russell Rd. I believe that consideration should be given to narrowing the carriageway width to 2.75m, which would give more room for active travel modes. A roadway width of 5.5m is still within DMURS guidelines for an Arterial or Link street. This would allow space to widen the cycle lanes beyond 1.5m which is very narrow.
Consideration of a bi-directional cycle lane and other design aspects of a similar active travel scheme in Dun Laoghaire.
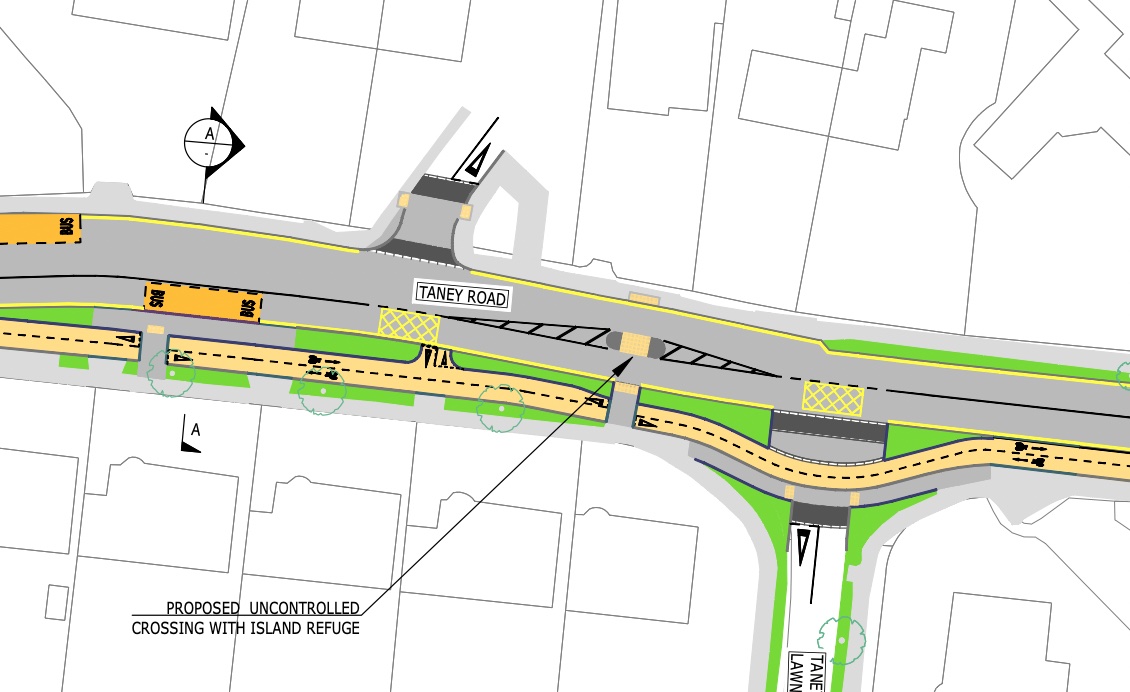
Fr. Russell Rd is not too dissimilar to the R112 Taney Rd between Stillorgan and Dundrum in the Dun Laoghaire County Council area. Coincidentally this road is also subject to a proposed active travel route: , and it may be useful to consider some aspects of this scheme, in particular:
A 3m bidirectional which was considered better than 2 x 1.5m lanes
Continuous cycle lanes and footpaths over side junctions, with set back used so that cars cross the cycle lane and footpath at a more perpendicular angle
Bus stops inline with the road carriageway
Unsignalised pedestrian crossing points across the cycle lane at bus stops
The proposed strategy is not consistent with the Climate Action and Low Carbon Development (Amendment) Act 2021.
A reduction in emissions of 35% over 2018 levels by 2030 proposed in the Strategy is not consistent with the national climate objective, and when taken with 2030 targets from other draft plans published by the Authority in 2022 (Greater Dublin Area: -37.5%; Waterford -26%) raises questions of how the Authority is performing its functions consistent with the provisions of the Climate Action and Low Carbon Development (Amendment) Act 2021.
“(1) A relevant body shall, in so far as practicable, perform its functions in a manner consistent with—
(a) the most recent approved climate action plan,
(b) the most recent approved national long term climate action strategy,
(c) the most recent approved national adaptation framework and approved sectoral adaptation plans,
(d) the furtherance of the national climate objective, and
(e) the objective of mitigating greenhouse gas emissions and adapting to the effects of climate change in the State.”.
– Climate Action and Low Carbon Development (Amendment) Act 2021
The proposed strategy is not consistent with the National Planning Framework
The Modelling Report notes that “The NTA, in association with Limerick City and County Council (LCCC) and Clare County Council (CCC) prepared a Planning Datasheet for the 2040 Land-use Scenario for the application within the LSMA Transport Strategy. This Planning Datasheet has been used as the baseline land-use scenario for all modelling of the strategy options and preferred strategy.”. This planning data sheet assigns the majority of population growth in a ‘doughnut’ arrangement on greenfield sites at the periphery of the city. This is in direct contravention of the policy outlined in the National Planning Framework where 50% of growth in regional cities will be developed within their existing built-up footprints. Furthermore, concrete plans being progressed by state agencies (e.g. the Land Development Agency’s plan to deliver over housing for 6,000 new residents on the lands surrounding Colbert Station) have been ignored in the proposed Planning Datasheet.
National Policy Objective 3b
Deliver at least half (50%) of all new homes that are targeted in the five Cities and suburbs of Dublin, Cork, Limerick, Galway and Waterford, within their existing built-up footprints
– National Planning Framework
The proposed strategy is not consistent with the National Sustainable Mobility Policy
The National Sustainable Mobility Policy sets out a target of a 10% reduction in kilometres driven by fossil fuelled cars by 2030. The Strategy proposes an increase in road capacity through the fact that it “commits to delivering the N/M20 Cork to Limerick Scheme and the N69/M21 Foynes to Limerick Road” as well as proposed roads to open up development lands in the suburbs. The Strategy fails to address any induced demand that will be caused by these projects in the Limerick Shannon Metropolitan Area. Outside of the city centre area, the Strategy fails to identify any measures that could reduce road capacity that would result in traffic evaporation.
Targets
To deliver at least 500,000 additional daily active travel and public transport journeys and a 10% reduction in kilometres driven by fossil fuelled cars by 2030 in line with metrics for transport set out in the Climate Action Plan 2021
National Sustainable Mobility Policy
The proposed strategy is not consistent with the Authority’s own guidance on bus network design
The Authority published an excellent consultation as part of its work on the Cork BusConnects project which outlined two fundamental issues relating to bus network design: the tension between coverage and ridership; and the importance of interchange in providing a coherent public transport network that can deliver modal shift. Unfortunately the proposed bus network for Limerick consists of a series of meandering routes optimised for coverage with few interchange possibilities. Exacerbating this is a proposed traffic arrangement for the city centre which insists on directing buses through O’Connell St, away from the bus and rail station and preventing effective interchange between services.
A well-connected network is key to high patronage. Interchange must be easy and reliable so that people can reach many destinations in a reasonable amount of time, at a reasonable cost.
Bus Network Redesign Volume I: Choices Report – BusConnects Cork